|
Data from the first 2,000 recorded rescues (you read that right) has been collected, calculated, and collated for all you nerds. Data Drop....Visibility at Victim v Total Recorded Rescues. From the data below, we can see that 72% of recorded rescues happened in low and zero visibility. The data also shows that, not surprisingly, the survival rate decreases as visibility decreases (High Viz – 84%, Moderate Viz – 76%, Low Viz – 60%, and Zero Viz – 47%), so we need to make sure our training environment mirrors this apparent experiential truth. With the visual density and volume of smoke produced from most synthetic materials, operating in low and zero visibility is our reality. Like in all things, the more we learn about something, the more questions arise.
Search Culture 72% of our victims have been located in low to zero visibility. We should all hold ourselves, our crews and our departments accountable in these conditions and keep on the ground in these elements. Being low in low/zero visibility is where we can see/hear the farthest and feel for our victims the best. If a firefighter is walking during a low/zero viz search, grab them and tell them to get down and then ask “can you see better now?” Correcting this during an active fire will take a few seconds but will pay dividends for a career. Tripoding is great in larger open areas, hallways, areas where there may be stairs that lead down and when fire is below but in hoarder conditions and in close quarters such as bedrooms it really just isn’t always feasible and crawling or alike may be warranted. What’s best for our victims is not always what is comfortable to us but when we get over our ego, we can make our comfort level match that of what is best for our civilians. 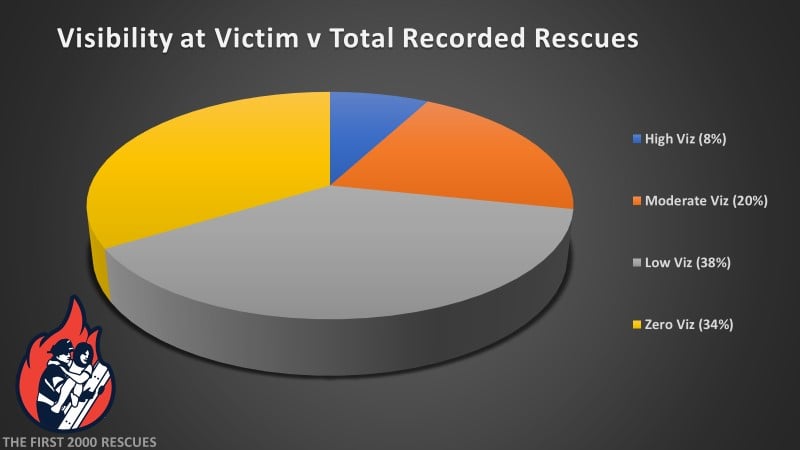
0 Comments
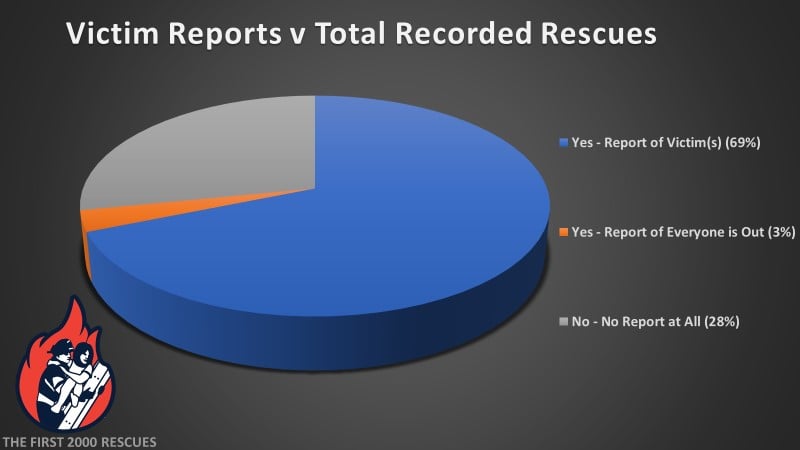
Data Drop.....When was Search Initiated v Survival Rate. Data from the recorded rescues so far show that survival rates are higher when search was initiated before fire knockdown, and also when search was initiated before RIT was assigned. The data also shows that the vast majority of recorded rescues had search initiated before knockdown (83%) and before RIT was assigned (95%). These facts, when combined lead to early search (pre-knockdown and pre-RIT assignment) accounting for the lion's share of all successful rescues (89% pre-knockdown; 96% pre-RIT assignment). As always, the more we learn, the more questions that arise: How early in your operations does your department prioritize search? How many members are typically assigned to search on your firegrounds? How often are we supplementing search by sending multiple crews to search different areas? Is there ever a fireground where one could justify triaging RIT before search? If so, can you given an example? When Was Search Initiated v Survival Rate: Pre Knockdown – 65% (1069/1653) Post Knockdown – 40% (129/322) * 89% (1069/1198) of all successful rescues were made when search was initiated before the fire was knocked down When Was Search Initiated v Survival Rate: Pre RIT/RIC Assignment – 66% (725/1091) Post RIT/RIC Assignment – 47% (27/58) * 96% (725/752) of all successful rescues were made when search was initiated before the RIT was assigned 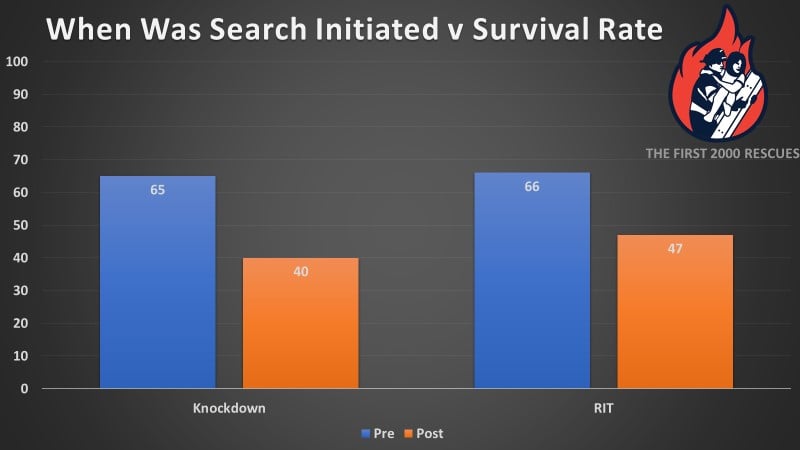 Data Drop...Cyanokit Use and Victim Burns v Survival Rate. While the sample size of victims given hydroxocobalamin (Cyanokit) is relatively small (n = 204 total), the numbers are definitely intriguing (this is obviously not a double-blind, peer reviewed, empirical study that meets the standard of the medical community). As you can see in the raw data and graph below, the survival rate for all three burn categories is higher when hydroxocobalamin is given to the vicitm. As always there are multiple variables at play, but we'll be keeping an eye on these numbers in future iterations for sure. As always, the more we learn, the more questions that arise: Does your department/local transporting agency carry hydroxocobalamin? If not, why (price, shelf-life, etc.)? Could you/they work with a local hospital/burn center to stock the medication? What are your/their indications for giving hydroxocobalamin? Victim Burns v Cyanokit v Survival Rate: None – (no Cyanokit) 72% (654/910) ; (Cyanokit) 77% (82/106) Mild - (no Cyanokit) 57% (230/407) ; (Cyanokit) 64% (42/66) Severe - (no Cyanokit) 37% (151/409) ; (Cyanokit) 53% (17/32) A big thanks to Robert McClelland for all his work on this topic. 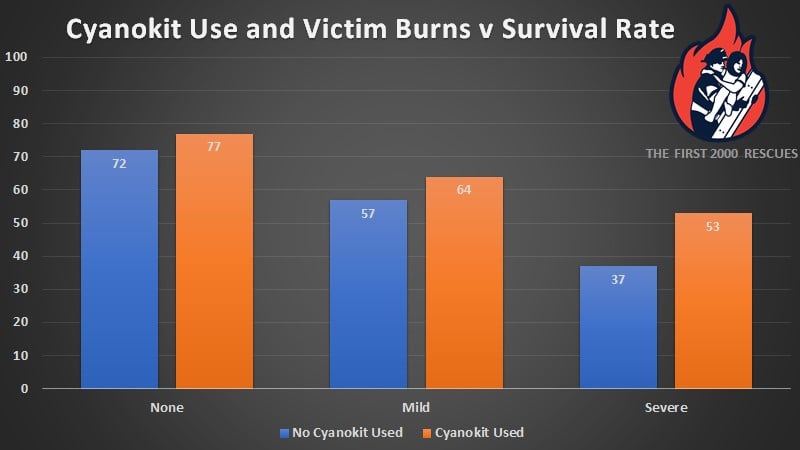 Data from the first 2,000 recorded rescues (you read that right) has been collected, calculated, and collated for all you nerds. Data Drop....Was Victim Behind a Closed Door v Survival Rate. Four primary factors impact the survivability of a given space inside a building on fire: the physical proximity to the fire (distance), the elevation in the space (dose), whether or not there is a closed door separating the fire from the given space (dose), and how long an area is exposed to fire (duration). UL Firefighter Safety Research Institute has long understood the importance of closed doors as life safety tools, and this objective fact has been demonstrated in dozens of full-scale fire experiments over the past ten-plus years. Now we have the experiential data to strengthen the already empirically proven claim. Data collected thus far shows that the survival rate of recorded rescues where victims were located behind a closed door is 86%, while the survival rate of recorded rescues where victims were not behind a closed door is only 62%...that’s a difference of almost 25%. Like in all things, the more we learn about something, the more questions arise. Does your department push the Close Before You Doze message during your public education campaign? Who do we preach this message to more than just the elementary aged kiddos? What about the elderly, parents, teachers, college students, etc., etc.? Do we train our members on how to present our public education messages, or do we just have the least senior member present? Like UL FSRI has been preaching, a closed door is not the only tool that we can give our citizens to help themselves in case of a fire. The three life safety pillars are: working smoke alarms, evacuation plans, and closed doors. 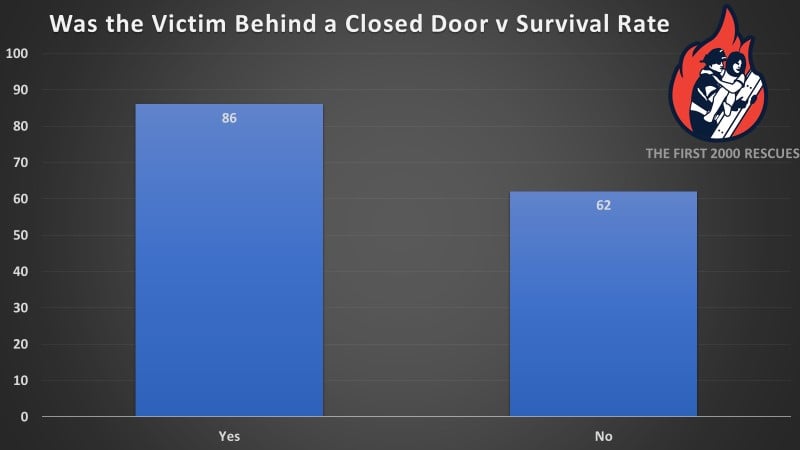 Data from the first 2,000 recorded rescues (you read that right) has been collected, calculated, and collated for all you nerds. Data Drop ....Victim Reports v Total Recorded Rescues. The graph below shows us that in 69% of all recorded rescues to date there were positive victim reports. Or if you look at this slightly differently, that in 31% of all recorded rescues to date there were no positive victim reports, meaning either there were no reports at all (n = 562), or reports that everyone was out (n = 61). Also, diving a bit deeper into the data, we can see that in 26% (16/61) of recorded rescues the report of 'everyone is out' was given by a resident of the fire building. The more we learn about decision-making under stress, the more we realize that there are serious valleys in our abilities when we’re (civilians and firefighters alike) under duress. This can explain why when someone’s world is burning in front of them (and they are potentially severely injured), they make relatively simple mistakes. Like in all things, the more we learn about something, the more questions arise.
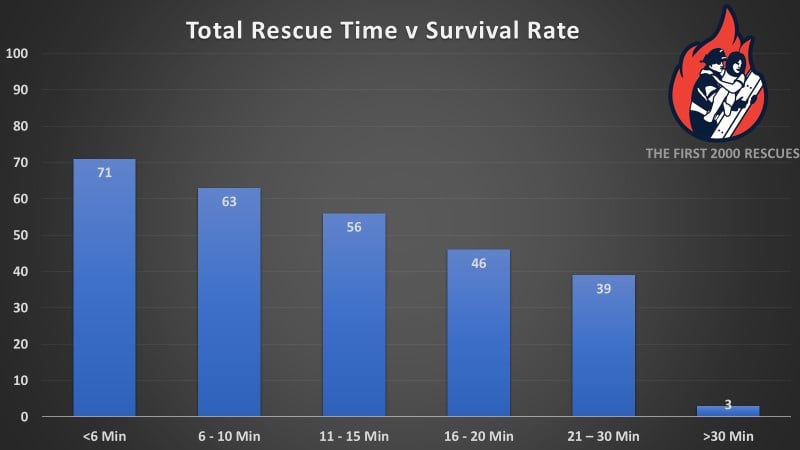
 Data from the first 2,000 recorded rescues (you read that right) has been collected, calculated, and collated for all you nerds. Data Drop......Total Rescue Time v Survival Rate. Total Rescue Time = Search Time + Removal Time = time from FD arrival on scene until victim removed from the fire building The graph below shows us that time and survival are inversely related. Meaning that as time increases, recorded survival rate decreases. This is intuitive to all of us (and to those not in the fire service) and is the reason that we have lights and sirens, Opticoms, stage our bunkers, train as hard as we do, etc. While we already had this tacit knowledge, we now have experiential data to fortify our intuition. Remember, this is their time, not ours. Like in all things, the more we learn about something, the more questions arise.
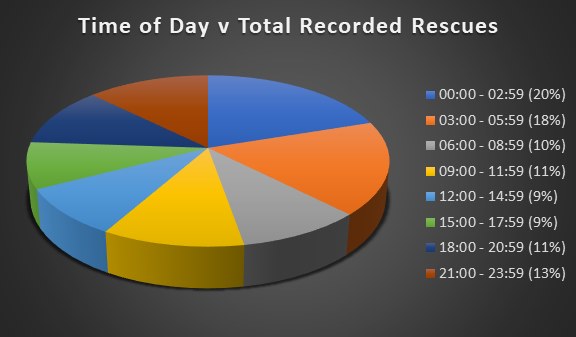
 Data from the first 2,000 recorded rescues (you read that right) has been collected, calculated, and collated for all you nerds. Data Drop ...Time of Day v Total Recorded Rescues. As you can see, the three biggest slices of the pie below are from 00:00 - 02:59, 03:00 - 05:59, and 21:00 - 23:59, respectively. Over 50% of all of our recorded rescues have happened between 21:00 and 06:00. This begs a couple questions:
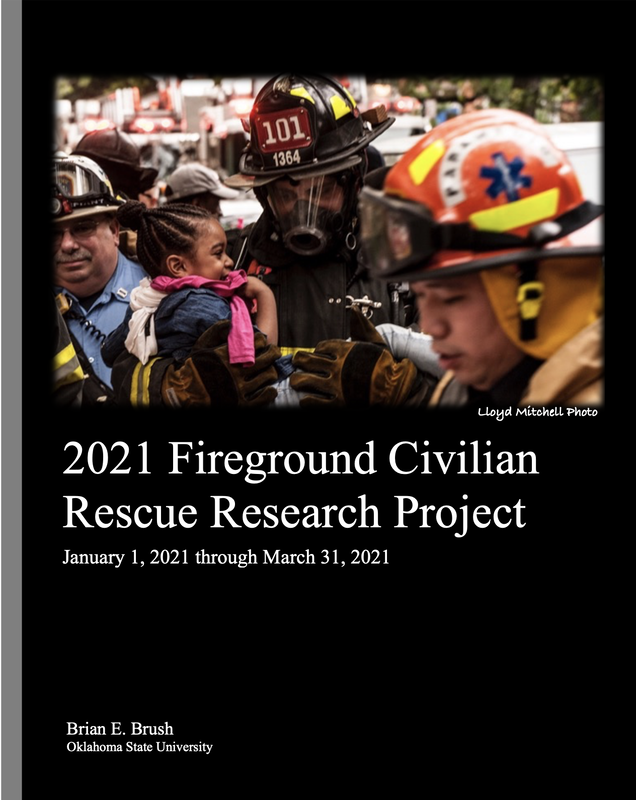
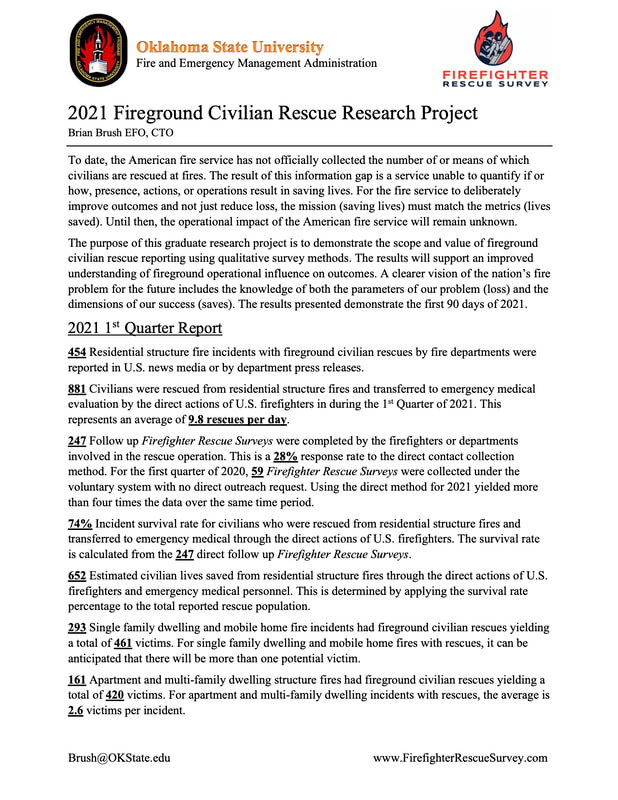
 “True learning involves figuring out how to use what you already know, to go beyond what you already think” Jerome Bruner Abstract To date, the American fire service has not officially collected the number of or means by which civilians are rescued at fires. Traditional fire service inputs and metrics are quantitative and negative; number of fires, property lost or damaged, number of injuries and fatalities. An unintended result of this methodology is a myopic data set with analysis limited to loss relationships. The demonstration of reduction in civilian fire deaths is only that; it cannot conclusively show more lives are actively being saved. The result of this information gap is a service unable to demonstrate how, presence, actions, or operations result in saving lives. For the fire service to deliberately improve outcomes and not just reduce loss, the mission (saving lives) must match the metrics (lives saved). Until then, the operational impact of the American fire service will remain unknown. The purpose of this research is to demonstrate the scope and value of fireground civilian rescue reporting and use of qualitative survey methods. The results will support an improved understanding of operational influence on civilian fire victim outcomes. A clearer vision of the nation’s fire problem for the future includes the knowledge of both the parameters of our problem (loss) and the dimensions of our success (saves). From January 1, 2021, through March 31, 2021, reports of fireground civilian rescues from news outlets, press releases and social networks were actively collected, confirmed and categorized. Organizations responsible for rescues were contacted, informed of the research project, provided a rescue reporting procedure template, and directed to complete a Firefighter Rescue Survey (FRS). The FRS is an online, qualitative research tool for collection and classification of the data from first-hand reports of those directly involved in fireground civilian rescues. In the first 90 days of 2021, there were 454 residential structure fire incidents with fireground civilian rescues by firefighters reported in U.S. news media or department press release. From those incidents, 881 civilians were rescued through the direct actions of U.S. firefighters and transferred to emergency medical for evaluation. This represents an average of 9.8 rescues per day. In the first quarter of 2021, 247 follow up Firefighter Rescue Surveys (FRS) were completed by the departments involved in the rescue operations. This represents a 28% response rate for the total number of civilian rescues recorded. In the first quarter of 2020, 59 FRS were collected under the voluntary system with no direct outreach request, and the total number of rescues for the first quarter of 2020 was unknown. This shows the direct contact method for 2021 yielded more than four times the data over the same time period. For the 247 Firefighter Rescue Surveys collected the incident survival rate for civilians rescued from residential structure fires was 74%. When this survival rate is applied to the 881 recorded fireground civilian rescues it can be estimated that 652 civilians’ lives were saved from residential structure fires by U.S. firefighters in the first quarter of 2021. Brian Brush Oklahoma State University To view, download, or print the full document, click the link below.
 We are often asked how firefighters can help the mission of the Firefighter Rescue Survey. The most proactive step you can take is to institutionalize rescue reporting for your department. THANK YOU to Clackamas Fire District #1 for the example to be shared! Attached to this post is a rescue reporting SOP template for your department to use as a foundation. Clackamas FD #1 shows us how easy it is to take that template and put it inservice. Help ensure your rescues get recorded and the information is shared by making it policy and proceedure. 
To date, the American fire service has not officially collected the number of or means of which civilians are rescued at fires. The result of this information gap is a service unable to quantify if or how, presence, actions, or operations result in saving lives. For the fire service to deliberately improve outcomes and not just reduce loss, the mission (saving lives) must match the metrics (lives saved). Until then, the operational impact of the American fire service will remain unknown. The purpose of this graduate research project is to demonstrate the scope and value of fireground civilian rescue reporting using mixed methods of positive metrics and qualitative survey methods. The results will support an improved understanding of fireground operational influence on outcomes. A clearer vision of the nation’s fire problem for the future includes the knowledge of both the parameters of our problem (loss) and the dimensions of our success (saves). The results presented demonstrate a study conducted over the first 90 days of 2021.
  |
Fire Service WinsA collection of news and articles related to search and search culture. Archives
May 2023
Categories |
||||||||||
 RSS Feed